Use Docker, Uptime Kuma, and Traefik To Monitor Your Website
Ensure the stability and availability of your websites, blog, or else with Uptime Kuma. An intuitive, lightweight service that can be run in Docker.
Introduction
Within this article, I want to show how you can set up website monitoring from your local PC or a server with Docker/Docker Swarm. Instead of using complicated monitoring stacks like prometheus, node-exporter, or graphana I want to show a lightweight alternative called Uptime Kuma which is written in NodeJs and Vue.
The project is open source and can be found on GitHub: https://github.com/louislam/uptime-kuma
Important properties that convinced me to use this alternative are:
- The UI is beautiful!
- Super easy setup with Docker/Docker Swarm
- Unbelievable easy configuration
- Notifications via Discord, Slack, Email (SMTP), and more. Click here for the full list.
Prerequisite
To run Uptime Kuma on a server or on your local machine you have to prepare your environment. I personally love to run Traefik as a reverse proxy that runs in my Docker Swarm and is deployed with Docker Compose. With Traefik you can create a single Compose file and deploy any service and it will automatically issue Let's Encrypt certificates for your domain.
I will shortly explain these two prerequisites and then will show how to use them to deploy Uptime Kuma.
Docker
Docker is a widely used platform for developing, shipping, and running all kinds of applications. It enables you to separate infrastructure from your applications to quickly deliver software from one machine to another.
Implementing software while using Docker often negates infrastructure problems like the common "works on my machine" problem:

To install Docker on your system or server you follow the official tutorial on docker.com.
If you only want to host Uptime Kuma on your local machine, you are using Windows, and aren't allowed to install Docker Desktop you can follow this guide:

Traefik
What is Traefik?
Traefik Makes Networking Boring
Cloud-Native Networking Stack That Just Works.
Traefik is used to forward incoming requests to a service deployed in a Docker environment. Also, it has the ability to create Let’s Encrypt SSL certificates automatically for every domain which is managed by traefik.
To set up a local Traefik service within your Docker environment you can download this Docker Compose file and execute the following commands:
1. Create an external network that is used for Traefik
$ docker network create traefik-public2. Export needed variables
export PRIMARY_DOMAIN=yourdomain.de
export TRAEFIK_SSLEMAIL=youremai@yourdomain.de
3. Deploy
$ docker-compose up -dTo access the traefik dashboard you can hit https://dashboard.yourdomain.de and login with:
username: devadmin
password: devto
For deploying Traefik within a Docker environment in Docker Swarm mode you can download this Docker Compose file, do Steps 1 and 2, and deploy it with:
docker stack deploy -c docker-compose.traefik-swarm.yml traefikTo get a deeper understanding of Traefik you can read about how to deploy it in Docker within this article and how to deploy it in Docker Swarm mode within this article.
Deploy Uptime Kuma With Docker
Deploying Uptime Kuma can be done in three different environments: Locally with Docker, on a server with Docker and Traefik, and on a server cluster running Docker in Swarm mode and Traefik.
Deploy locally within your Docker Environment
The easiest way to test Uptime Kuma is running it locally on your own device by creating a new Docker Compose file and pasting the following content into it:
version: '3.3'

services:
  uptime-kuma:
    image: louislam/uptime-kuma:latest
    container_name: uptime-kuma
    volumes:
      - ./uptime-kuma-data:/app/data
    ports:
      - "1337:3001"
    restart: always
This Docker Compose file simply uses the official Uptime Kuma image, maps the port to 1337, and uses a shared folder to save the data folder from Uptime Kuma.
Run the Docker Compose file by switching to the folder and executing:
docker-compose up -dAfter the command is finished you can reach your Uptime Kuma instance by opening https://localhost:1337/
Deploy remotely on Docker/Docker Swarm With Traefik
If you run your own server and have either running a single server with Docker or a server cluster with Docker in Swarm mode you have to update the Docker Compose file.
I will assume that you have set up your Traefik instance as described in my tutorials
Create a new Docker Compose file and paste the following content:
version: '3.6'

services:
  uptime-kuma:
    image: louislam/uptime-kuma:latest
    container_name: uptime-kuma
    volumes:
      - data:/app/data
    restart: always
    networks:
      - traefik-public
    labels:
      - traefik.enable=true
      - traefik.docker.network=traefik-public
      - traefik.constraint-label=traefik-public
      - traefik.http.routers.uptime-kuma-http.rule=Host(`monitor.${PRIMARY_DOMAIN?Variable not set}`)
      - traefik.http.routers.uptime-kuma-http.entrypoints=http
      - traefik.http.routers.uptime-kuma-http.middlewares=https-redirect
      - traefik.http.routers.uptime-kuma-https.rule=Host(`monitor.${PRIMARY_DOMAIN?Variable not set}`)
      - traefik.http.routers.uptime-kuma-https.entrypoints=https
      - traefik.http.routers.uptime-kuma-https.tls=true
      - traefik.http.routers.uptime-kuma-https.tls.certresolver=le
      - traefik.http.services.uptime-kuma.loadbalancer.server.port=3001
networks:
  traefik-public:
    external: true

volumes:
  data:
Before deploying this Docker Compose file you have to export your domain as you did for Traefik:
export PRIMARY_DOMAIN=yourdomain.deAdjust other settings to your needs (Domain, container_name, network, and volumes) and deploy Uptime Kuma:
docker-compose up -dFor Docker in Docker Swarm mode with Traefik use this Compose file, create a new Node Label named monitor on the node where you want to save your data, export your PRIMARY_DOMAIN, and deploy it with:
docker stack deploy -c docker-compose.monitoring-swarm.yml monitorAfter some seconds/minutes, Uptime Kuma is deployed successfully and you can access your instance on https://monitor.PRIMARY_DOMAIN/
Configuring Uptime Kuma
After Uptime Kuma was deployed successfully the first time you access it, you have to configure a secure admin password.
Once you're done, start adding your first monitor by pressing this button:

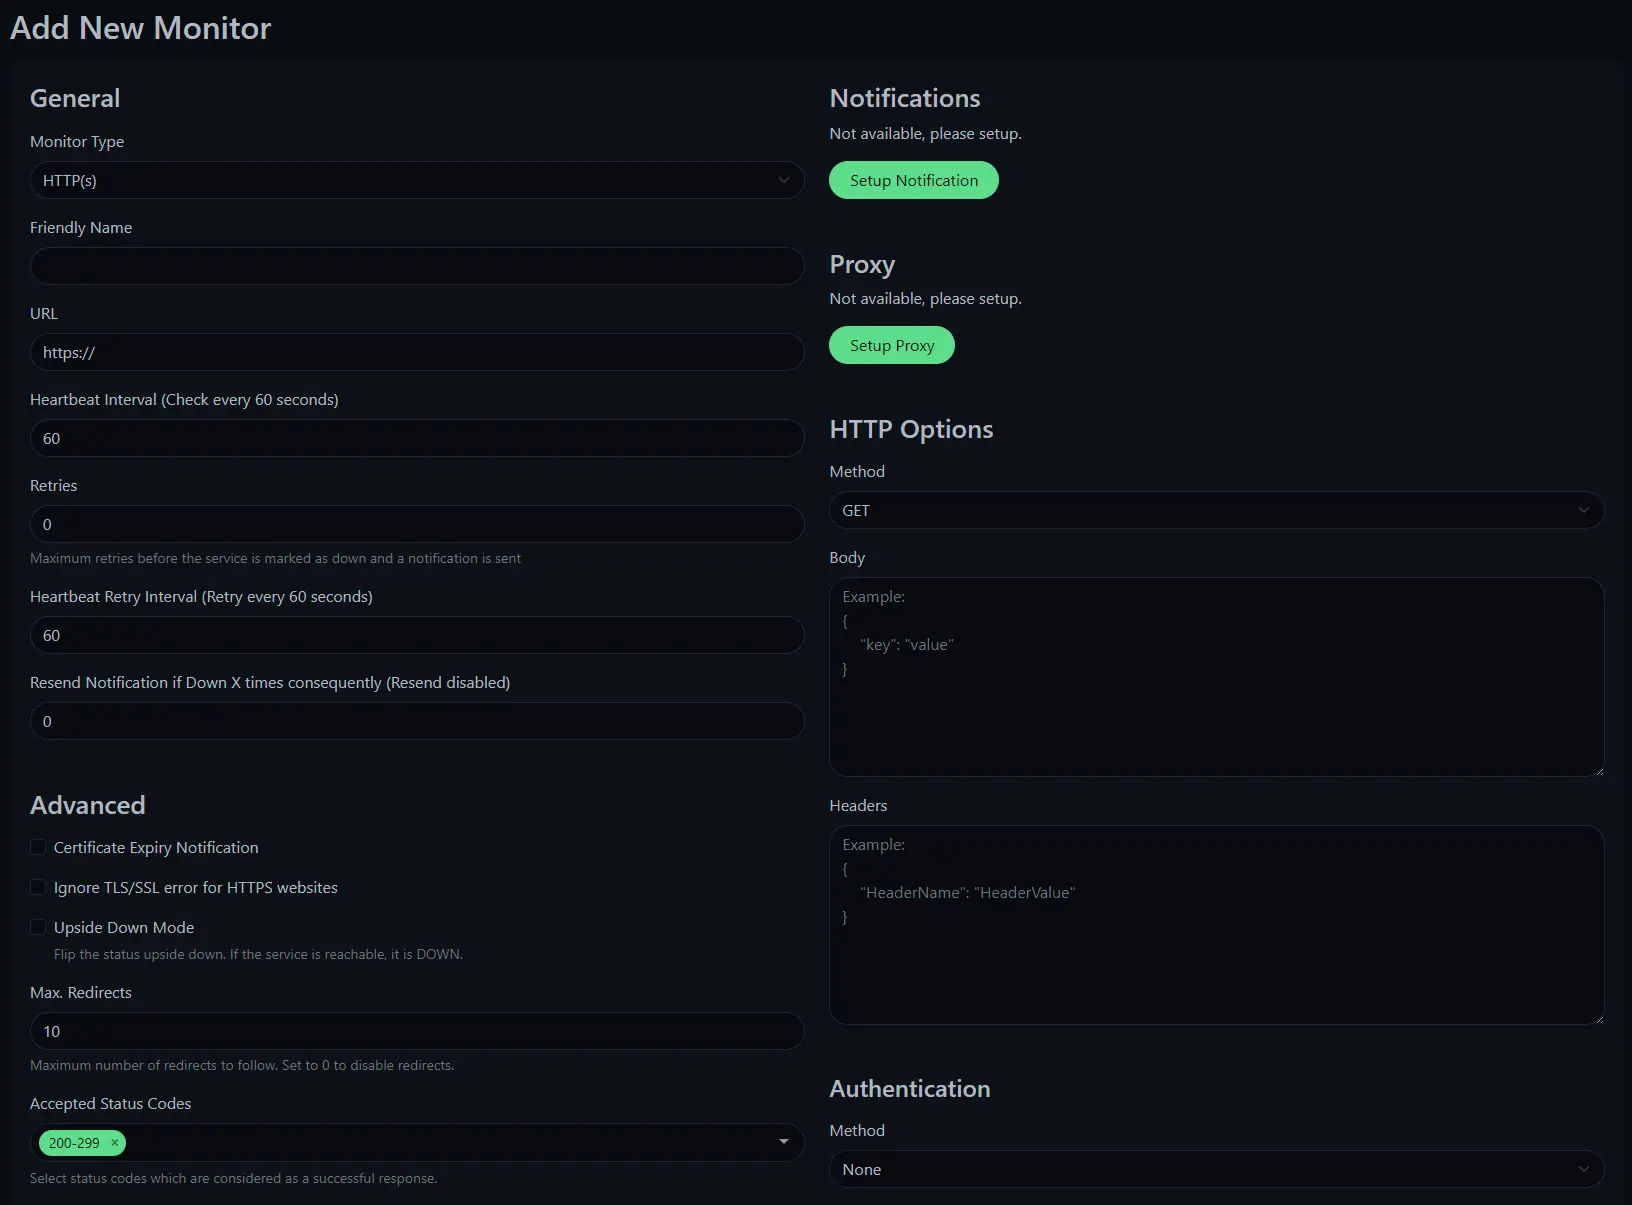
A new UI will pop up where you can define a particular behavior:

Now, that you have created your first monitor, you should configure any type of notification (Discord, Email, or other). If you do you will be notified every time one or more monitors are not working as expected. Doing this is normally very easy and will be explained in the following.
Creating a Discord Notification (and Slack, Teams)
To enable a Discord Notification (or Teams, Slack) you need a Discord (or Teams, Slack) Webhook for the server and channel where Uptime Kuma should send the Alert. In Discord, you can get this by opening Server Settings -> Integrations -> Create Webhook. After you created your Webhook copy the Webhook URL. It should work nearly the same in Teams or Slack.
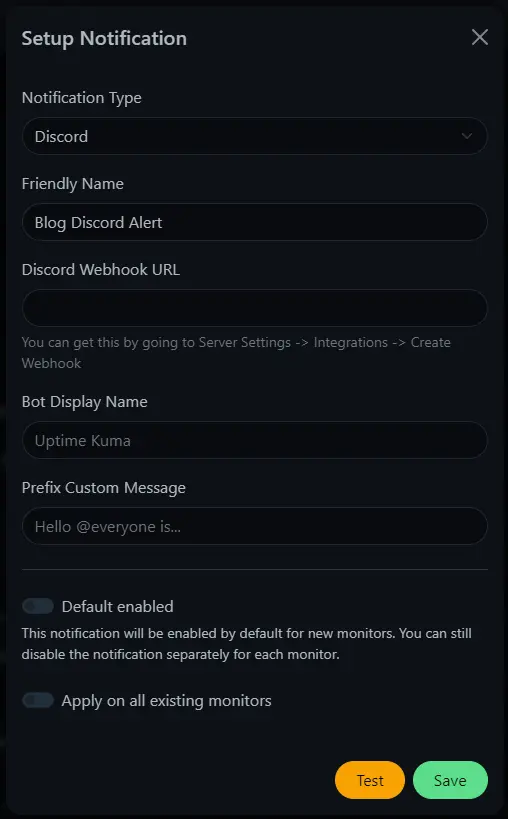
Then edit your Monitor and press "Setup Notification". Within the appearing dialog, you select choose Discord (or Teams, Slack), give it a friendly name, and paste the Webhook URL. For Discord the UI should look like this:

You can set it as default for every newly created monitor and can also apply it to all existing monitors by enabling the checkboxes at the bottom.
Creating an Email Notification
If you do not want Discord, Teams, or Slack notifications you can also create an email notification. To do this you need your Email Accounts Hostname, Port, Username, Password, a From/To Email, and auth method setting (StartTLS or SSL). You can also enable it as default for new and add it to all existing monitors.
Closing Notes
Within this article, I showed how to install Uptime Kuma locally and on a Docker or Docker Swarm environment with a Traefik reverse proxy. I think that this lightweight tool is great to monitor any website because it is easy to set up and provides a lot of configuration options. I would recommend Uptime Kuma to any software developers or blog hosters to ensure that their services or blogs are running properly.
This is the end of this tutorial. Hopefully, you are now able to set it up. If you still have questions you can just ask in the comment section.
Also, if you enjoyed reading this article, consider commenting with your valuable thoughts! I would love to hear your feedback.
Feel free to share this article with anyone and connect with me on Medium, LinkedIn, Twitter, and GitHub.
🙌 Support this content
If you like this content, please consider supporting me. You can share it on social media, buy me a coffee, or become a paid member. Any support helps.
See the contribute page for all (free or paid) ways to say thank you!
Thanks! 🥰


